After a hiatus over summer and the start of the academic year, I finally have some more progress to report. Using the packed square visualisations as a base, I've been adding more data elements from the Series dataset, and working towards visualising relationships between Series and the Agencies that generate their content. This has taken longer than planned due to more data-plumbing issues, which I'll come to later.
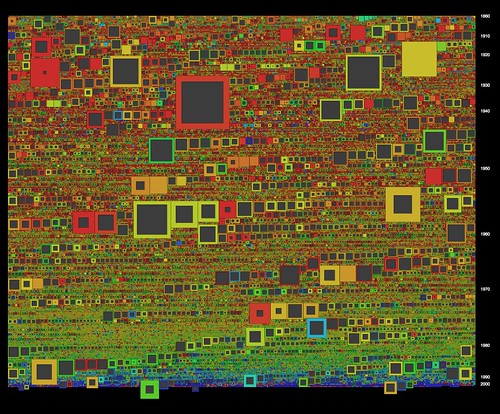
The Archives' Series data records two kinds of links: Series-Agency and Series-Series. The latest sketches make a start in visualising both of these. Here colour (or more accurately hue) is derived from the first listed Recording or Controlling Agency. As the CRS Manual explains, the Recording Agency generates the records; while the Controlling Agency is the "agency currently responsible for some or all of the functions or legislation documented in records." In either case, given that there are some 9000 Agencies involved here, how do we visualise this link? For the moment I'm doing it in the simplest possible way: low Agency numbers have low hue values (red), while high Agency numbers have high hue values (blue to purple). There are a number of problems with this - notably that it's impossible to tell the difference between, for example, CA 11 (Treasury 1901-1976) and CA 12 (the PM's Department 1911-1971) - which is a very significant difference. These two images show the difference between visualising Recording Agency (top) and Controlling Agency (bottom).

Series data also records links to other Series, which come in three flavours: Succession (between previous and subsequent series), Controlling (where one Series acts as an index or register for another) and Related (for other relationships). In this dataset (57.5k Series) there are some 7.5k succession links, 6.2k controlling series links, and 25k related series links. My initial attempt to render all of these (by just drawing a line between linked Series) resulted in a giant, unreadable cloud. A simpler and more legible approach is to only draw links for one Series at a time.
In the latest interactive sketch, a single Series' links are drawn as coloured lines: controlling links are red, succession links are blue, and related Series links are yellow. Clicking a Series selects it and draws its links, rendering linked series in colour while dimming the rest to grey (clicking the Series again unselects it and returns to Technicolor mode). This begins to show the potential for a visual interface to the collection, I think. Here's the applet - note that it's fairly screen and memory-hungry. Feedback welcome, as always.

There are a few changes behind the scenes here as well. As outlined earlier, XML has been a mixed blessing: easy to use and human-readable, but the file sizes are large, and the DOM parsing method used in Processing is memory-hungry and slow. For these sketches I've switched to JSON, a simple, lightweight data format with its own Java library. So far, JSON is working nicely; its file sizes are around half those of the equivalent XML files, parsing is much faster, and the parsing code is simpler and neater. This thread has lots of useful info on implementing JSON in Processing.
HashMaps are the other new toy here. I'd never quite found a use for them until now, but because they easily connect an object (in this case a Series) with an index string (in this case a Series ID), they are essential here for building Series-Series links. I simply store each Series' links as a list of ID strings, then to draw the link, feed each ID into a HashMap to access the whole Series object. Thanks to @blprnt and @toxi for reminding me why I needed HashMaps!
Next: digging deeper into the complexities of Agency-Series relations.
