In the last post I outlined the main approach used to visualise Series A1 - a word frequency cloud based on item titles, showing co-occurrences between terms. Here I'll show how that was expanded into an interactive tool for exploring the Series, all the way down to images of the documents themselves. If you're impatient, skip straight to the latest sketch for Mac, Windows and Linux (1.8Mb Java executables).
To turn the text cloud visualisation into a general-purpose interface, I added the ability to focus on terms (where focus means include only items containing that word). Exclusion and focus have an additive relationship; so I can exclude one term to create a subset of items, then focus on a second term to show only items in that subset, with a given term. I can also exclude, or focus on, multiple terms to further refine a subset. A simple interface allows for terms to be removed from any point in the sequence; so for example I can exclude all "naturalisation" items, then focus in on a second term (in the grab below, "immigration"). While this navigation technique isn't perfect, it is simple and scalable. We can rapidly move from Series level to small groups of items - in the grab below, we have zoomed from 65k items to 233 items, in two clicks. With this iterative navigation process, the co-occurrence display in the cloud becomes a useful way to scope or preview term relationships, and inform the next focus or exclusion.
The new visualisation element here is a simple histogram, showing the number of items with start dates in each year of the Series. The histogram visualises the current subset; so refining the text-cloud display also modifies the histogram; as well, hovering on a term in the cloud shows the relative distribution of that term, in the histogram. The date histogram becomes a powerful tool for exploration and discovery in this display. For example in the grab above, there's a big spike in the histogram in 1927: why? Hovering over the most prominent words in the cloud, we get a sense of their different distributions; for example "restriction" appears mainly between 1900 and 1915, whereas "deportation" occurs almost exclusively in items starting in 1927, and makes up most of the spike. Simply clicking either a term, or a histogram column, fills the lower pane with a list of relevant items, and from there we can explore much deeper - more of that later.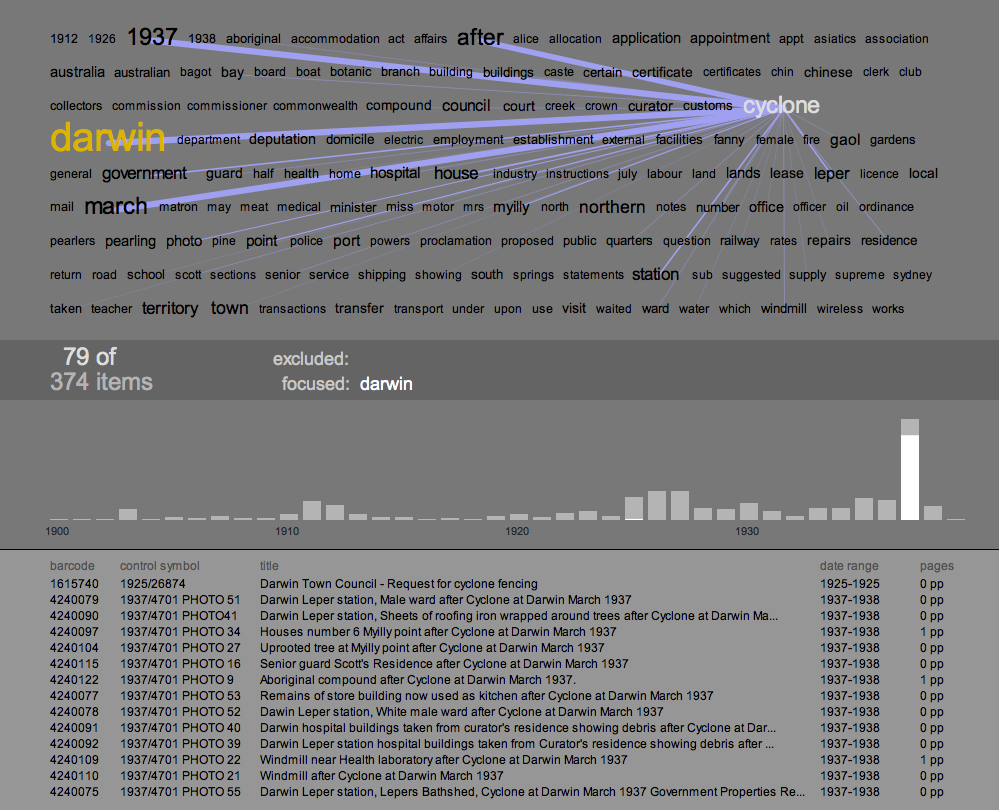
A second example of how the text cloud, co-occurrences, and histogram can combine to reveal patterns in the dataset, and prompt discoveries in the content of the series. Focusing in on "Darwin" reveals another big spike in the histogram, this time in the year 1937. In this case, the co-occurrences and the distribution of terms give an accurate preview of what the items in that spike are about: a cyclone hit Darwin. The text cloud even reveals the month of the event, and again the item listing shows fine-grained confirmation of the pattern.
The final challenge in this process was to zoom in again, to the level of the individual document. The Archives has digitised a significant chunk of its records - it currently stores 18.2 million images which are accessable through the search interface of RecordSearch. With the invaluable help of the Archives' Tim Sherratt, I can access these images dynamically by passing item details - barcode and page number - to an Archives PHP script. Because the dataset I am working with does not record the number of digitised pages, this is a two-stage process: first, query RecordSearch for the item details, and scrape out the number of digitised pages (shown in the right hand column of the items listing). Then, when an item in the list is clicked, load and display the page images.
This involved getting around a couple of little technical issues. The loading of the images was surprisingly straightforward. Processing's requestImage() function happily grabs an image from the web without bringing the entire applet to a halt. Loading the pages data was slightly harder, because loadStrings() does halt everything while it waits; and in this case, I wanted to load up to 14 URLs at a time. Java threads provided the solution - another case where Processing's ability to call on Java for backup was extremely useful.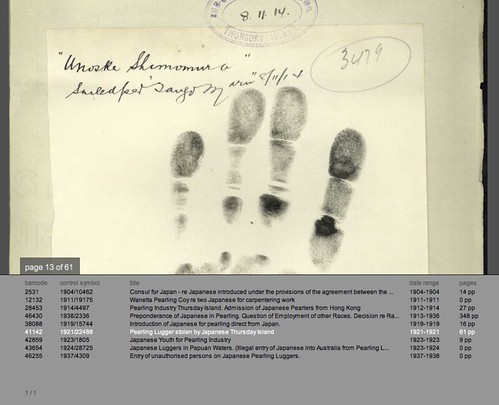
The first time I successfully loaded one of these scans - a crinkled, typewritten page, encrusted with notes - was a real thrill. What this shows is that given the opportunity, interactive visualisation can provide not only insights into the structure and content of an archival collection; it can also provide an interface to the (digitised) collection itself. If the text cloud and histogram visualisations hint at historical events in the items content, the page images let us verify or explore their leads in the primary sources. For example in the 1927 deportation items above, the digitised documents reveal cases where recent migrants were deported to their country of origin because of mental illness. The Immigration Act (1901-1925), quoted in these documents, gives the Minister the power to deport recent arrivals who are convicted criminals, prostitutes, or "inmates of insane asylums." Not what I expected to find - but that's good, if the aim here is exploration. There's an amazing wealth of material in here - and it is beautifully material: the screen grab above shows a page from item 1921/22488, which documents the theft of a pearling lugger by its (indentured) Japanese crew. This page shows a handprint of one of the men, Unoske Shimomura, taken in 1914.
You can download the A1 Explorer applet for Mac, Windows and Linux (each is a 1.8Mb Java executable). System requirements are pretty minimal, though you will need a network connection to load images. One more caveat: the user interface is very rudimentary - again UI is not the focus of my research here - so below is a quick cheat sheet that should be enough to get you going. I'd love to hear your feedback on it, or any interesting discoveries you've made.
A1 Explorer Cheat Sheet
Text Cloud view
- hover over words to see correlations, item distributions and numbers
- click a word to load a list of its items into the lower pane
- to exclude a word and regenerate the cloud hold down '-' and click the word
- to focus on a word hold down '+' and click the word
- to remove a focused or excluded word, click on it in the central info bar
- use the up and down arrow keys to scroll through the items list in the lower pane
- click on an item in the list to load its page images and switch to document view
- page through the document with the left and right arrow keys
- drag the page image to move it
- press 'Z' to zoom the image up
- press 'H' to load a higher-resolution image of the current page
- press 'T' to revert to text-cloud view
